

Trending News
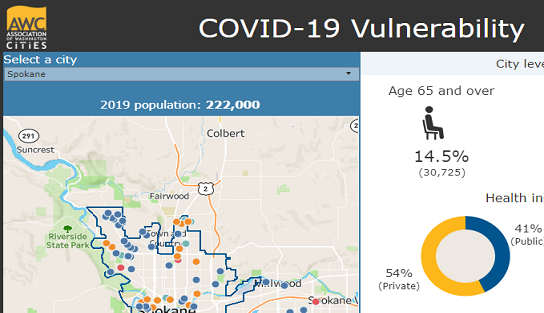
COVID-19 Vulnerability of Washington Cities
Helping cities quickly assess vulnerabilities of residents
As you can imagine, there are countless data interactives on COVID-19 – we’ve shared them as well and will continue to do so only if we believe they are helpful to spreading the facts to help you make informed decisions. Why are data interactives so helpful?
1) They allow you to get as much or as little information as you want in one place.
2) The information they provide can be obtained and absorbed quickly with the ability to dive deeper for those who want to.
A data interactive by the Association of Washington Cities does this by shedding light on the vulnerability of cities both large and small in Washington State.
Based on known vulnerabilities (those who are ages 65+, diabetics, or smokers, etc.), the risk for each city is based on the unique demographics and characteristics of each city, showing the estimated total and share of the population for a variety of vulnerabilities.
In addition to vulnerabilities, it shows positive aspects, or where a city might be better prepared should a major outbreak occur locally. These include number of facilities and the beds they contain for nearby or local: hospitals, skilled nursing facilities, assisted living facilities, and adult family homes.
Other vulnerabilities include the total and share of the city population: with a disability, with health insurance, and the homeless population.
If you have friends or family living elsewhere across the state or find yourself in a must travel situation, you will likely find this interactive helpful and interesting.
---------
U.S. Census: Young Adults and Higher Education
Exploring higher education trends and employment prospects
Every aspect of life revolves around the act of learning. First, we learn to walk, then we learn to read. Eventually, between the ages of 18 and 34, young adults often choose to take an additional step to further their education.
This visualization,Young Adults and Higher Education, uses 2017 American Community Survey (ACS) data to analyze gender income potential, and how the varying fields of study translate to occupations.
As the visualization shows, the human desire to learn characterizes all genders. In 2017, of all young adults in the United States, 20.9% of women and 16.9% of men had attained a bachelor’s as their highest degree. The visualization also showcases how these statistics can change over time. For example, 2006 saw a total of 17.3% of Women, and 13.5% of Men with a bachelor’s as their highest degree. This equates to a 3.6% and 3.4% total education increase over ten years, for women and men, respectively.
This visualization also provides income comparisons, per state, based on different levels of education completed. As our economy increasingly moves to a knowledge-based one, personal income becomes more tied to education level. In 2017, Washington state young adults that only had a high school diploma earned a median income of $31,431. Those whose highest degree was a bachelor’s earned a median income of $55,871. Those that had any degree above a bachelor’s earned a median income of $76,509. This is a spread of $45,078 between the lowest and highest median incomes by education.
Wages are tied to a certain extent, to specific occupations. The ACS survey tracks thirteen different degree options, ranging from business, engineering, literature and education. Each graduate’s occupation is mapped to a field of study.
For example, of all the degrees, Business was the most common degree type in 2017, accounting for 18.8% of all bachelors awarded. Of all students that held a business degree, 44.8% were employed in business, management, or finance. As the graphic shows, just 0.1% of business graduates were employed in farming or forestry operations. It makes sense, as good curriculum is designed to best prepare the student for a career in that specific field of work.
The connecting of major with its most popular occupations, showing the overall percentage of degree holders, as well as earnings by occupation for each state should help to inform any student facing the declaration of a major.
---------
Urban Institute: Mapping America's Futures
Test different scenarios to see the effect on population changes
One thing we can likely all agree on halfway through the year 2020 is very little appears average. Population growth or contraction is estimated using a variety of predictable variables so from one year to the next, there are not a lot of surprises. Over a decade, the increasing amount of time makes estimating population changes more difficult.
The Urban Institute’s Mapping America’s Futures allows you to change a few variables to see how the overall population might be effected.
The map begins with average rates and All Ages and Races. More specifically, options include possible scenarios of Low, Average, or High rates for Births, Deaths, and Migration. Map filters include four age groups (0-19, 20-49, 50-64, and 65+) and All Ages, as well as by four race categories (White, Black, Hispanic, and Other).
Commuting Zones (CZ) are unique, often crossing county and even state boundaries. CZ’s were created to best reflect local economies regardless of traditional geographical borders. There are 740 unique CZ’s offered in this tool.
Select an area by clicking on the map. This zooms into the selected CZ or state. Scroll down below the map to see age and race detail, and further down to see a breakdown of 18 unique age groups by race. Changes occurring from 2000 to 2010 are actual while estimating each decade through 2030.
The Spokane Area CZ includes Spokane, Lincoln, and Pend Oreille counties in Washington State, and the majority of the Idaho Panhandle. Not to spoil everything this interactive has to offer, the Spokane Area CZ is projected to grow by 165,806 residents, or by 23.88% from 2010 to 2030.
While this tool was available before COVID-19, it can perhaps still inform by selecting Low for Births and Migration and High for deaths. However, we do not know what the final impact of the virus on the typical population changes occurring over a decade.
Yet, demographers write that due to the impact of COVID-19, U.S. birth estimates for 2021 and the foreseeable future, might see as many as one-half million fewer births annually. Ultimately, only time will provide answers to the overall impact, but the Mapping America’s Futures tool might provide us a sneak-peak more important now then when the Urban Institute released this tool a few years ago.
Bur the big question remains whether the larger (over 1 million) metro areas will change from typical growth to a decrease or if their mid-size counterparts, like the Spokane and Boise metros, will start to see larger than predicted population growth.
Trends In Action
Free & Reduced-Price School Lunches
Stabilizing and adapting to COVID-19 school closures
by Brian Kennedy and Dr. Patrick Jones
The average cost difference between a full and reduced-price lunch is about $3.00. While this may not seem like much on the surface, for some students this could be the difference between going hungry or having proper nutrition for their studies. Especially in a time with school closures and where health is at the forefront of our thoughts, schools’ ability to provide meals to children has acted as a lifeline to many struggling during the crisis.
The cost of a school lunch in Spokane County is roughly $3.25 but about only two out of five students are paying that, due to the free and reduced-price lunch program. Understanding how many students and what their share of total enrollment provides a good measure for relative poverty. Captured in Indicator 2.5.5, the data show how that trend has been moving over the past twenty years.
The National School Lunch Program (NSLP) is served in public and private schools throughout the United States. It is a program under the authority of the United States Department of Agriculture but administered at the state level by the Office of Superintendent of Public Instruction (OSPI). There were over 339 public school districts, private schools, charter schools, and tribal compact schools that were participating in the NSLP in the 2018-2019 school year. According to OSPI, although all students may participate, the income eligibility guidelines for school meals are intended to direct benefits to those children most in need. The guidelines are based on the federal income poverty levels (FPL) and revised annually. Eligibility for free lunches is at 130% or less of the FPL and reduced-price eligibility lies between 130 and 185% of the FPL.
Stating the income thresholds of 130% and 185% of the FPL can seem abstract, but according to the U.S. Department of Health and Human Services, the poverty level for a family of four was $25,750 in 2019. Thus, for such a household, qualifying households for free and reduced-price lunches, would earn below $33,475 and $47,638, respectively.
In Spokane County, the 2019-2020 school year showed that 45.7% of all students were enrolled in the NSLP, just 2.4 percentage points higher than the state average at 43.3%. However, there is a bit of variation across the school districts in the county. Among the two largest school districts, Spokane Schools sits considerably higher, at 56.7%, the highest among the county, yet the share of second-largest district, Central Valley, is 35.2%, among the lowest in the county.
While over the last twenty years the overall share in the county has increased by ten percentage points, the trend seems to have stabilized. Over the last decade the share has increased by only one percentage point. Even within the county there hasn’t been a lot of variation among the school districts, with each showing roughly the same trend of growth over the last ten years, give or take just a few percentage points.
In the 2019-2020 school year there are 34,890 students enrolled in either the free or reduced-price lunch program within the county. While a vast majority of students in the NSLP, 82% or 28,442 students, qualify for free lunch this share hasn’t always been so defined. The share of student qualifying to free lunch as opposed to reduced-price lunches has consistently been increasing. Going back twenty years, 69% of students in the NSLP qualified for free lunch and just ten years ago that number climbed ten percentage points to 79%. Now, and for the last few years that number has hovered around 82%.
Despite all the uncertainty surrounding school closures during the COVID-19 pandemic, school districts across the county have stepped in to provide some certainty around child nutrition. Spokane SD has set up grab and go meals with 24 distribution sites throughout the city, Central Valley SD has done the same in the valley with 15 different locations. In most cases they are offering meals between 11am and 1pm (varying among locations) to any children under the age of 18, whether they are enrolled in that school district or not. Additionally, school buses, no longer taking students to and from school, are providing mobile meals to areas in the community with the highest need. More information for Spokane SD can be found here. Distribution sites and available programs can all be found on the school district web page (Cheney, Deer Park, East Valley, Freeman, Mead, Medical Lake, Nine Mile Falls, and West Valley).
So, while it is true that compared to twenty years ago, throughout the county the share of students qualifying for free and reduced-price lunches has increased significantly, that share has shown signs of stabilizing with no substantial growth in the last ten years. This is an important trend to follow as it is a proxy measure for relative poverty. More importantly the growth is showing that more children are being positively impacted by receiving basic human needs and nutrition for future development.
---------
Household Internet Connections
Internet in the home is now for work and school too
by Dr. Patrick Jones
Who in Spokane ever anticipated the daunting challenges the corona virus has posed? A few of course, among them our hospitals. By and large, we have all been cast into new worlds of individual and collective behavior since mid-March.
One of those worlds is the conversion of our lives to virtual interactions. This applies to many in business, certainly most of the educational institutions and a good part of our social lives. How many of us knew Zoom six, even three, months ago? Yet today, we can’t get by without it or likeminded products. Zoom business meetings, Zoom live entertainment, government by Zoom, cooking by Zoom, family reunions by Zoom, and again for educational institutions, commencement exercises by Zoom.
Behind our ability to connect this way lies an important measure of life in the early 21st century: the degree of internet penetration. Without widespread connectivity, we simply cannot connect with each other as we have before. And that physical connectivity needs to be fast enough to handle the demands of video communications in groups, sometimes large ones. This infrastructure certainly counts a piece of pandemic preparedness.
Spokane Trends contains two measures that help us understand where our county stands with internet connectivity: Indicator 0.3.5, the Number and Share of Households with Internet, and Indicator 0.3.6, Share of Internet Connection by Type. Generally, the two indicators tell a positive story., but one that can be improved.
Taking up the first, which considers total connections and their penetration into the households of the county, we can observe for the most recent year, 2018, the following: about 185,000 households enjoyed some form of internet connection, translating into about a 90% penetration. The compares favorably to the U.S. rate of about 85%. The rate here is essentially equivalent to that of the state. Internet penetration in Spokane County is also the highest among all eastern Washington metro areas, with the Tri Cities ranked second.
A connection (or not) is one measure. But the “size of the pipe” of the internet into our homes and businesses is another. Does Spokane’s high rate of internet penetration generally permit high bandwidth content like Zoom? Indicator 0.3.6 tells a little less optimistic story. For 2018, about 82% of county households enjoyed a form of broadband. This rate is about the same as the U.S. For Washington state, the equivalent measure was nearly 86%. Doing the math on the data from the two indicators, we can estimate that about 77% of all Spokane County indicators enjoyed broadband connection.
Does that share leave enough connections so Zoom or its like can bring most people? Together? Yes, that is, unless you’re poor. The Census, source of the two indicators, breaks down internet connectivity by income. It should come as no surprise that connectivity moves positively with household income.
One of the many geographical regions defined by Census is a Public Use Microdata Area, or PUMA. Spokane County contains four PUMAs. Within a PUMA, one can find cross tabulations of one measure of interest with another. What do the most recent PUMA files for Spokane County show for the relationship between household income and internet connectivity? Generally, a confirmation of the positive relationship. In the four districts, those households at or below the Federal Poverty Level (FPL) reported that about 10-15% had no internet connection. Those at the opposite end of the income spectrum – 501% or higher than the FPL - reported that only 3-4% were without an internet connection. In other words, those at or below the FPL were three or four more times likely to report that they had no internet connection than those with high incomes.
If we then want to understand the distribution of internet connections, and certainly broadband connections, look no further than our county’s poorest neighborhoods. This status has certainly weighed on the current efforts by county school districts to conduct education online. Either low income families haven’t been able to provide computers for their kids or if they have, they don’t enjoy broadband connections. The digital divide usually refers to yawning differences in connectivity between rural and urban America. Spokane County has its own version of the divide.
It is unclear whether the causes of absent broadband in certain neighborhoods result from the absence of the physical infrastructure or from adequate income to afford the service. The best explanation is probably a combination of both. Closing the digital divide within our county poses some interesting policy questions. Is this an area that local government can or should play a role – either from financial incentives to providers or to households? Might federal funds help the constraint of low physical connectivity?
The COVID-19 pandemic has certainly shown that high speed internet connectivity is now essential infrastructure. But unlike the universal service requirements of utilities, that connectivity at this point is far from universal.
---------
Recidivism: Rearrest, Reincarceration, or Reconviction Within 36-Months of Release From Prison
by Scott Richter and Dr. Patrick Jones
Reforming the criminal justice system is more than a catch phrase and the demand to do so has intensified exponentially with recent high-profile events.
But criminal justice reform is a large umbrella capturing many different areas, including police reform, prison reform, sentencing reform, solitary confinement reform, death penalty reform, and criminal law reform – just to name a few.
In the 1970s and 1980s, sentencing reform was more about establishing mandatory minimum sentences aimed at the creating same punishment for the same conviction with tiered levels of punishment for previous criminal convictions or extenuating circumstances. Three-strike laws (three qualifying convictions = life in prison) are similar in how the punishment is pre-established for specific convictions, or automatically adding 5-years to the sentence of someone convicted of using a firearm in the commission of a felony. The main point of agreement on both sides was mandatory minimum sentences were fair because punishments would be the same and harder for anyone to receive differential treatment.
Almost coming full-circle, sentence reform today would prefer fewer mandatory minimum sentences and more discretion in the hands of judges, so sentencing might be more reflective of each individual case. Additionally, sentence reform today includes continued growth of community sentences (probations, community service), and deferments through drug or mental health courts. A common point of agreement is while punishment still needs to exist, often there are options other than incarceration.
Arguably, it was the reformation of the mental health system in the U.S. in the 1960’s responsible for large-scale deinstitutionalization of mental health facilities and psychiatric wards. This created a situation where many people once treated in these facilities were now more likely to be caught-up in the criminal justice system.
There are many variables and ultimately, they all strive in their own way to reduce crime and keep the community safe. However, one thing almost all people currently incarcerated have in common is they have sentences that will end, and they will be released.
Upon release, it is ultimately the responsibility of individuals to not return to incarceration. Resources during and after incarceration can help, but for those with mental health, substance abuse issues, or no friends or family to help in the transition to freedom, this time can be fraught, with few legitimate opportunities and many paths back to prison.
Recidivism, defined by the U.S. Department of Justice, Office of Justice Programs, National Institute of Justice as “criminal acts that resulted in rearrest, reconviction or return to prison with or without a new sentence during a three-year period following the prisoner's release”, is a major part of how a criminal justice system is graded. Were current goals and processes successful at reducing crime? Has it reduced the re-offense rate of persons with a previous serious criminal conviction?
A report by the U.S. Bureau of Justice Statistics released in 2014 found of all incarcerated persons released from a state prison in 2005, “About two-thirds (67.8%) were arrested for a new crime within 3-years.”
While this share is high, keep in mind two things. The first, recidivism includes a re-arrest and does not require a conviction, or an attempt to prosecute. Second, state prisons, are typically where those convicted and sentenced to a year or more are held (representing the worst of crimes), not to be confused with jails where pre-trial holds (those not qualifying for bail or cannot meet bail financial terms) and those serving sentences of less than a year are held.
The Spokane County recidivism rate by type of original crime, is the share of convicted felons who were released from prison, who had been rearrested, reincarcerated, or reconvicted within 36-months of release. The most recent data available (2015-2017) are those people who completed their sentences and were released from prison in 2015.
This most recent 36-month period (2015-2017) had the highest overall recidivism rate in the series, at 42.1%. A breakdown of the overall rate was:
- 5.2% for drug crimes, the lowest in the series.
- 15.8% for property crimes, the lowest since 2011-2013.
- 8.4% for violent crimes, the lowest since 2009-2011.
- 12.8% for “Other” crimes, the highest in the series.
The “Other” category includes all other felony crimes not in the violent crime category (murder, robbery, rape, aggravated assault), property crime category (larceny / theft, burglary, motor vehicle theft), or drug crimes.
Recidivism data is usually part of evaluating the efficacy of reintegration programs and resources available inside and out of prisons. Understanding what recidivism can and cannot tell us about reoccurring crime should be a part of the overall discussion on criminal justice reform.
Learn more about recidivism and how recidivism is measured from the National Institute of Justice.
---------

5-Questions with:
Heather Hamlin
Executive Director, Women Helping Women Fund (WHWF) of Spokane
Q1) First, can you tell us what the priorities of WHWF in Spokane are for 2020? Have they shifted due to the pandemic?
A1) Women Helping Women Fund is committed to building a large community of educated, strategic givers who are inspired to make lasting change. With donor support, we awards grants for local programs, scholarships to young mothers and provide research to inform and affect policy impacting women and children in Spokane County.
Both fundraising and grantmaking look different during the pandemic. The goal this year was to allocate more funds to few nonprofits to make a bigger impact in the community.
Q2) How does WHWF use data? What are the key measures you are now tracking?
A2) We focus on issues that empower women and children to create healthy families and vibrant communities. Last year, we released a landmark collaborative report on the State of Women and Children in Spokane County. This report signified a shift in focus for our organization. We have access to health, economic, and nonprofit data from many different organizations. We asked—what if we synthesized that data through a lens focused on women and children?
Not only would we be able to see where the greatest need was and adjust our funding to proactively tackle issues, we could also track need over time to see if we were helping to actually making a difference. In addition, we could share this information with non-profit agencies, city and county officials, and other organization to help focus on areas that the data indicated were gaps and needed attention.
This project confirms that social and economic factors in Spokane County are key in determining the quality of life for women; by extension, they strongly influence the lives of children and family here. Opportunity and privileges are unequal. Therefore, life experiences, and health and well-being, especially among those living in poverty, are unequal. As the report shows, we have a lot of work to do. But we know that we can do it together.
Q3) Are there measures on Spokane Trends that your organization pays special attention to? If so, can you tell us what they are?
A3) Absolutely. We pay special attention to income and poverty trends through Economic Vitality, Early Learning trends and Education Attainment trends.
Q4) You have been professionally active in Spokane for 15 years now, holding jobs in both the private and non-profit worlds. Over this time, have you noticed a change in the attitude among colleagues toward data and decision-making?
A4) Yes, I've seen many organizations in both private and nonprofit sectors focus more on data informed decision making in recent years. It's also been surprising to see the number of organizations that have implemented excellent processes for data collection but still lack the tools to analyze data effectively.
Q5) This year, you are the chair of the board of Priority Spokane. What issues and then measures is Priority Spokane now putting center stage of its work?
A5) Priority Spokane will be focused on further researching, expanding, and reinforcing the use of peer support to address family trauma and violence in our region.