Welcome to Spokane County!
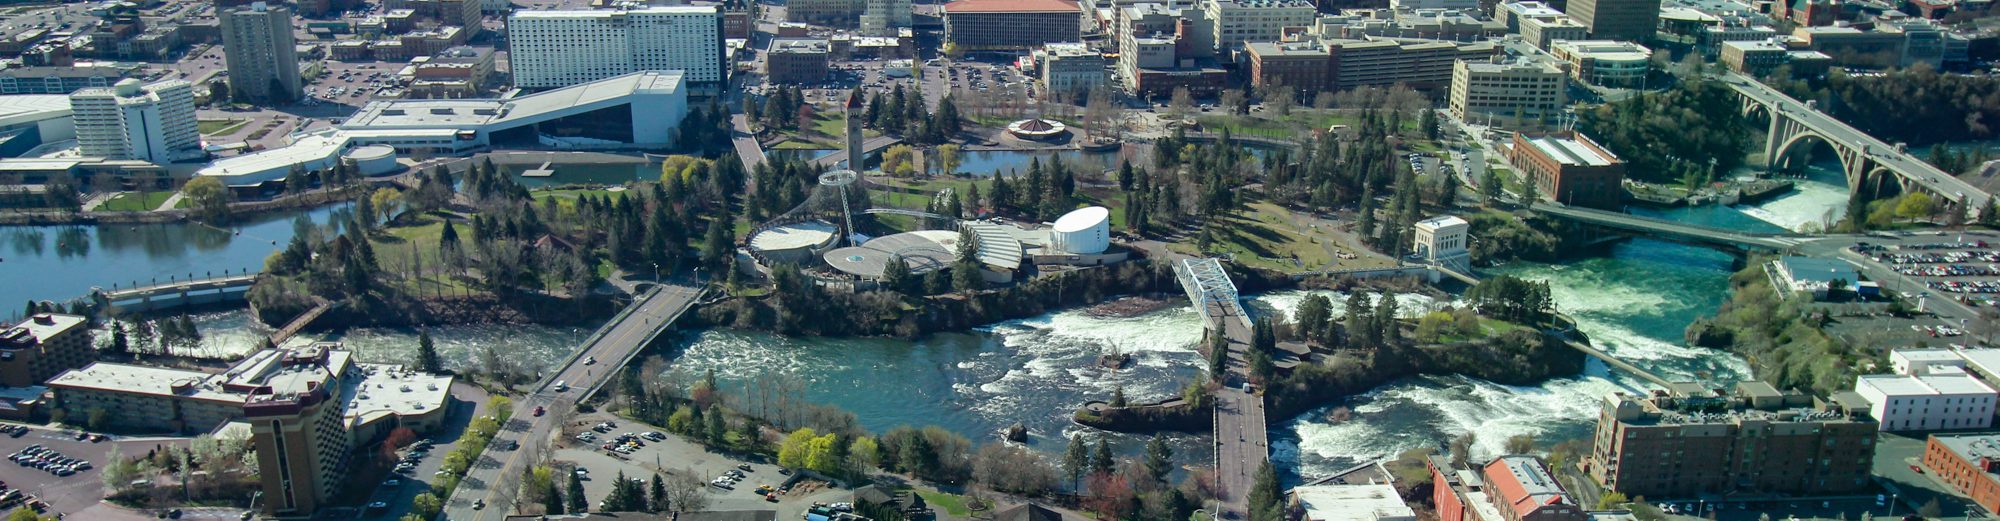
Spokane County and environs form the 97th largest MSA by population, but combines the best of both a large and small city environment. A large, rushing river runs through the County, with lakes and mountains within a half an hour drive. The community is home for four universities, a diversifying economy, significant sports and cultural events.
Recent Updates:
In PEOPLE: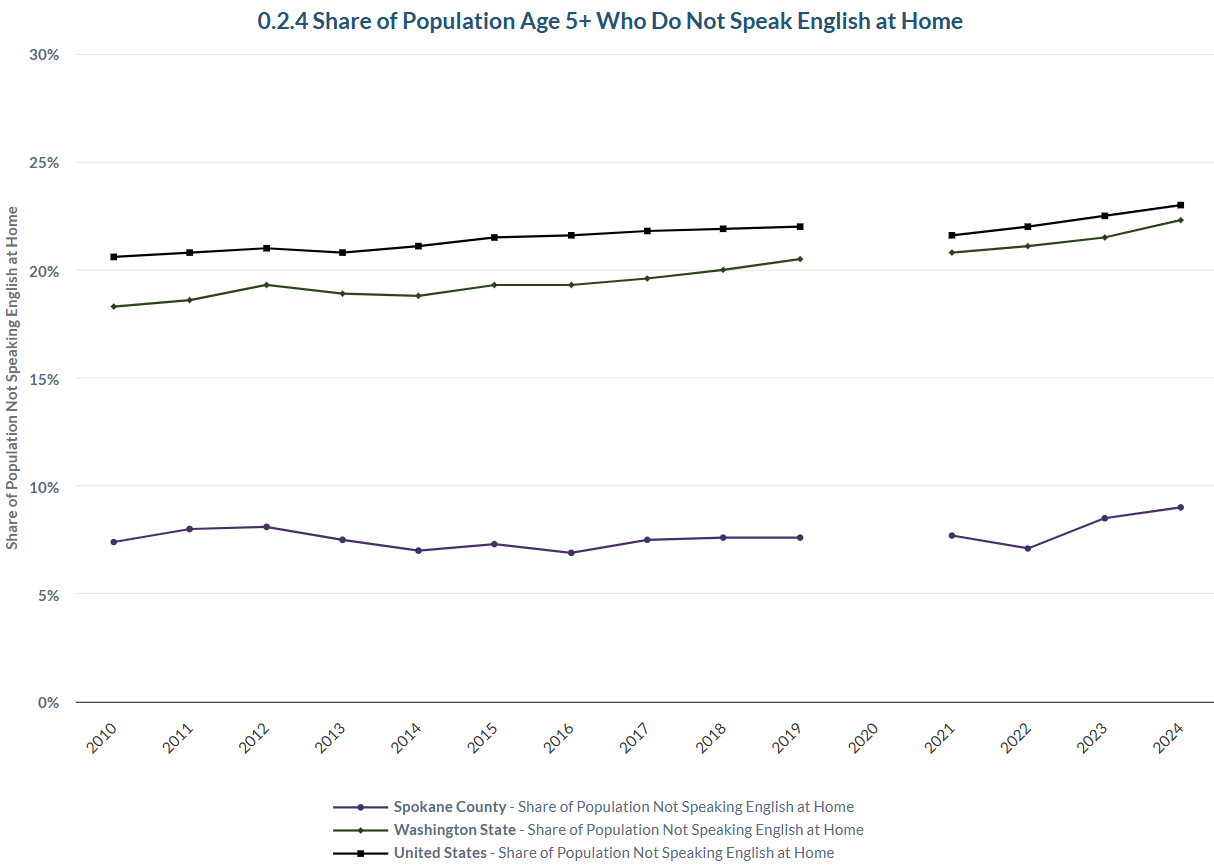
The share of the county population not speaking English at home has gained a bit but remains low.
The number of residents who don’t speak English at home gives insights into the size of the immigrant community. Since the estimate may include American-born family members, it is a larger number than a sister measure, the foreign born.
For 2024, Census estimated the share of the County population who do not speak English at home at 9%, a slight increase over the prior years. The gaps to similar measures for the state and the U.S. remain large, however. They are more than double, at 22% and 23%, respectively. There has been little upward movement in the local share over the past decade.
Despite the many efforts to welcome immigrants to the county, Spokane is hardly a hotspot for this vital part of the contemporary American experience.
In CULTURE & RECREATION: 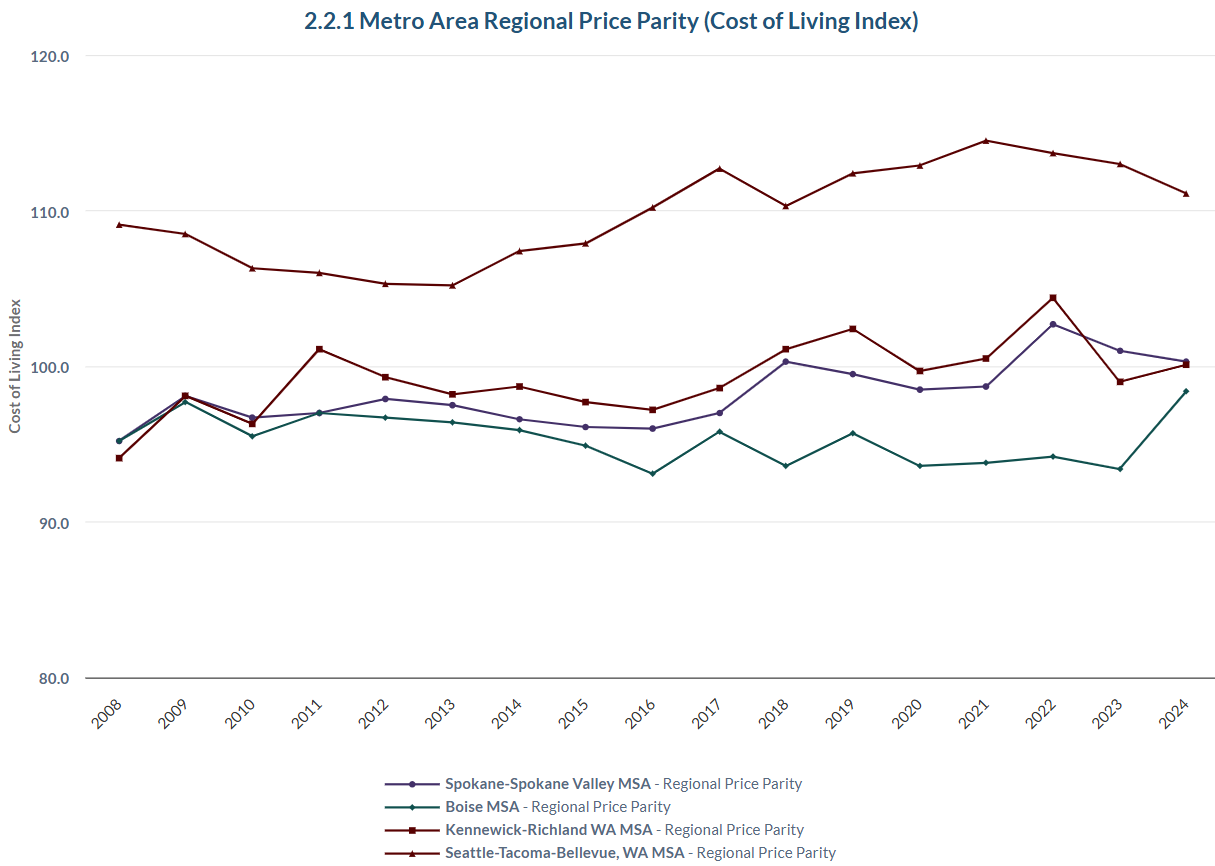
The price parity index indicates the Spokane metro area is no bargain.
This measure from the U.S. Bureau of Economic Analysis compares the cost of living of one metro area in the U.S. to the national average. This not the Consumer Price Index, with “standalone” values; rather, it’s a ratio. 100 then indicates that a metro area is right at the average; less than 100 signifies lower costs than average.
For the most recent year, 2024, the Spokane MSA (metropolitan statistical area) displayed a very average overall cost of living, at 100.3. The Spokane MSA consists of Spokane and Stevens Counties. The reading equaled the index value for the Tri Cities but was slightly higher than in the Boise MSA (98.4). Note the elevated reading for the Seattle metro area.
A decade ago, the Spokane metro area could claim to be less expensive than the national average, with an index value of 96.
In ECONOMIC VITALITY: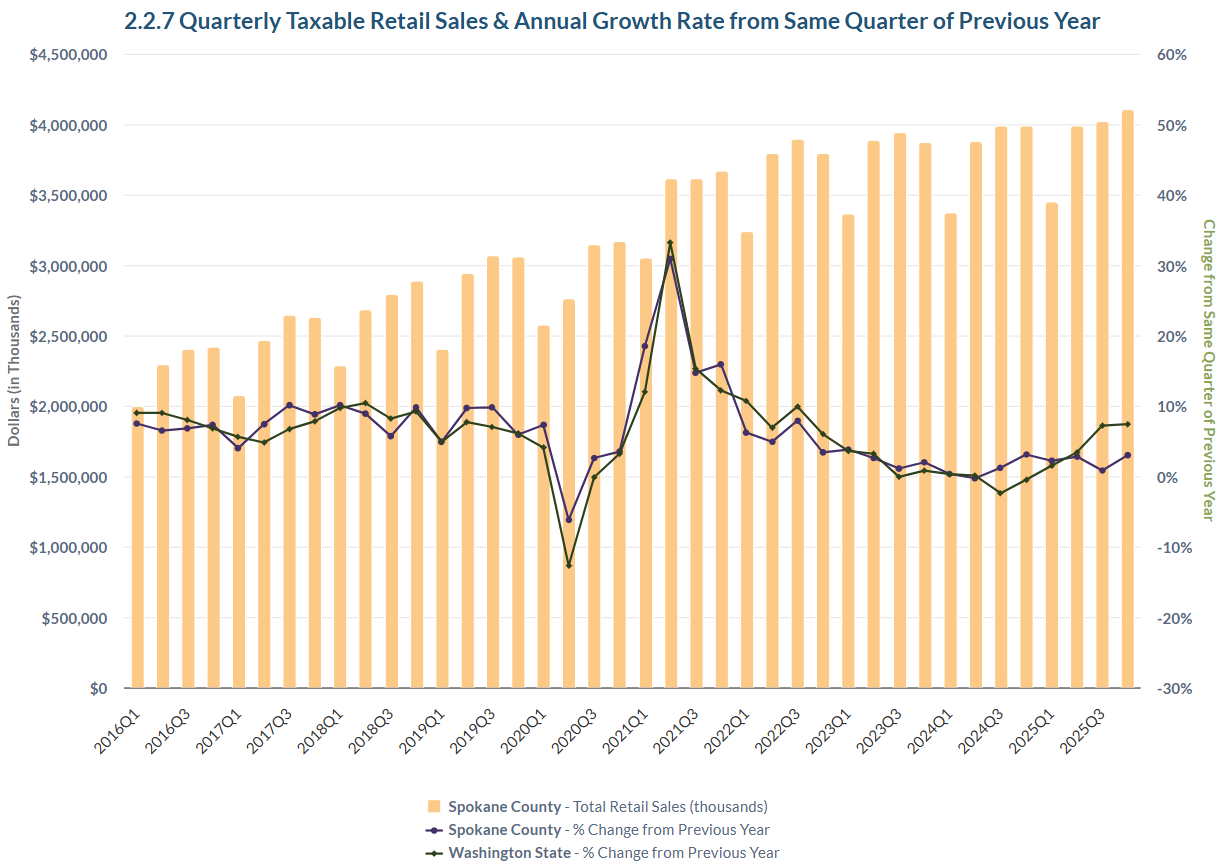
Levels of taxable retail sales give us a good sense of the strength of the consumer economy. And in the state of Washington, add to that the robustness of the construction industry, as all activities in this industry face the tax. In addition, retail sale tax flows are an important leg in the revenue streams to local and state governments.
The Washington Department of Revenue (DOR) publishes the taxable retail sales annually, and quarterly, with about a five-month delay. This indicator tracks the higher frequency view. In data just released by the DOR, county retail taxable sales of the fourth quarter of last year rose to $4.1 billion. This represented the highest quarter ever and a 3% increase from Q4 of 2024. The rate, however, was less than half of the percentage increase statewide (7.4%).
Between the county’s two largest cities, the city of Spokane Valley “outperformed” the city of Spokane by a wide margin: 7.8% to 1.4%.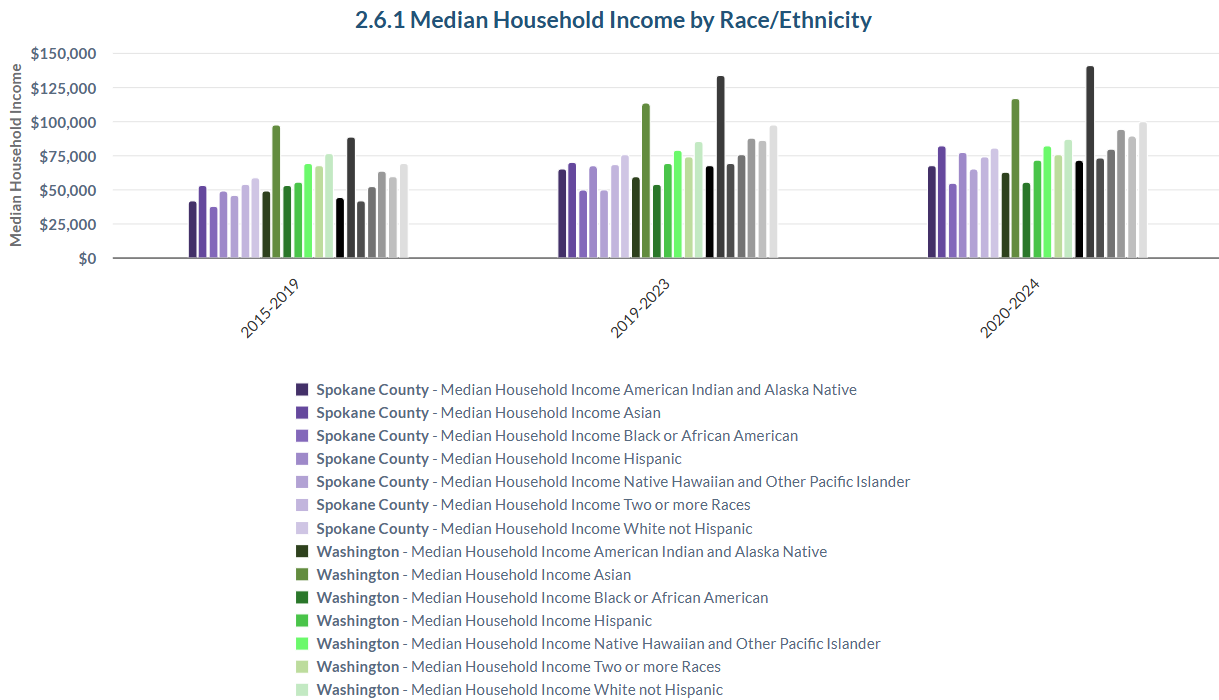
Median household income by People of Color in the County has grown faster than non-Hispanic Whites.
Median household income (MHI) may well be the single most important measure of economic progress. It represents a better “middle value” of the income distribution and uses a unit, the household (most often family), that represents how most Americans work and live. This indicator tracks MHI for six groups of People of Color as well as for White-Non-Hispanics in the County. Due to the generally small size of the samples, Census, provider of this measure, rolls up 5 years of data to arrive at reasonable estimates.
For the 2020-2024 period, MHI for American Indian/Alaskan Natives was $67,400; for Asian Americans, $81,500; for Blacks, $54,600; for Hispanics, $77,200; for Native Hawaiian/Pacific Islanders, $64,600; for Two or More Races, $73,800; and for Whites-non-Hispanic, $80,300.
Of these groups, incomes of American Indians/Alaskan Natives grew the fastest over the decade 2015-2024, followed by Hispanics. The MHI of all County racial and ethnic groups lies below their U.S. counterparts, although for American Indians and Hispanics, not by much.
To simplify the graph, click on the item(s) in the legend you would like to hide.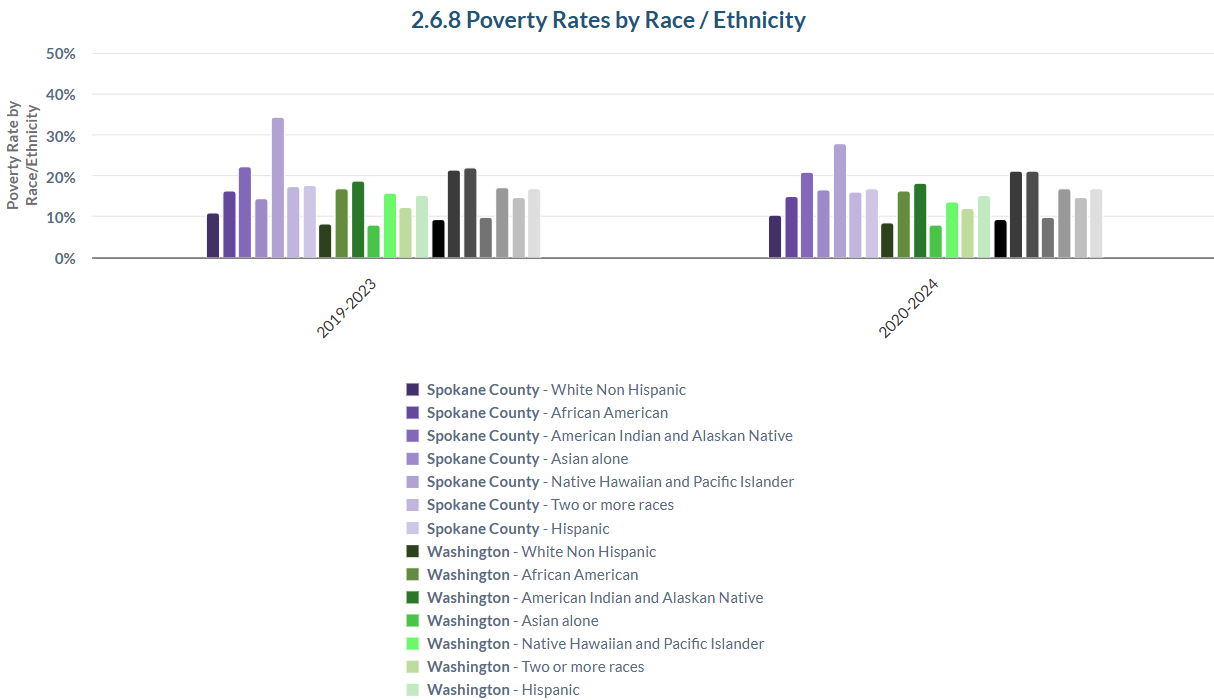
The official poverty rate, set by Census, gives an idea of the size of the U.S. resident population occupying the bulk of the lowest quintile of the distribution of personal income. Dating to the 1960s War on Poverty, the rate is based on thresholds that vary by family size and adjust upward every year to match the growth of the Consumer Price Index.
This measure establishes the rate for six groups composing the population of People of Color in the County, plus for non-Hispanic Whites. As with the measure on Median Household Income, the data are presented in 5-year rolling averages.
For the most recent period, 2020-2024, the Census estimated the following rates: 14.9% for Blacks, 20.7% for Native American/Alaskan Natives, 16.5% for Asians, 27.9% for Native Hawaiian/Pacific Islanders, 16% for Two or More Races, 16.8% for Hispanics, and 10.4% for non-Hispanic Whites.
Except for Spokane County Asian Americans, all groups showed some improvement in their poverty rates from 2019. Except for Blacks and Whites, poverty rates here are above the rates of their national counterparts.
In EDUCATION: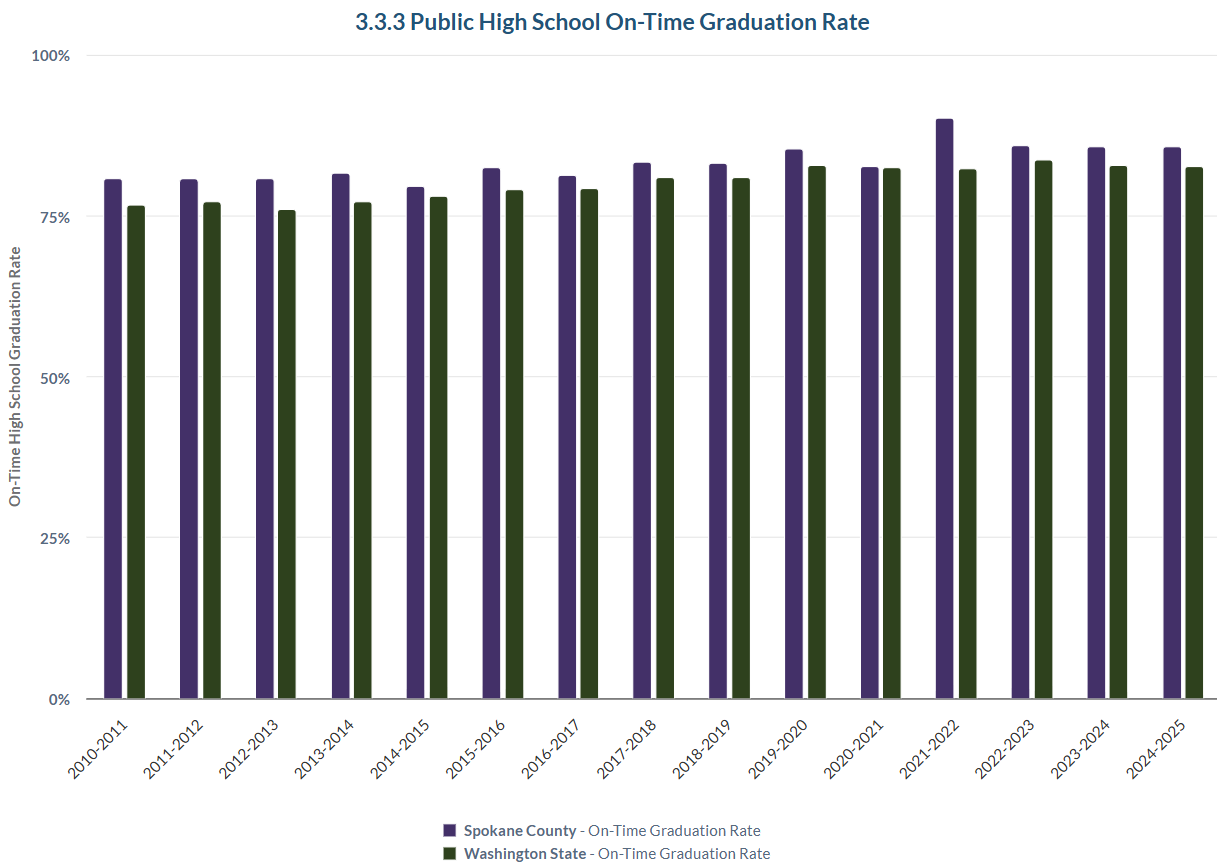
Spokane County schools continue to outperform the state for on-time high school graduation rates.
The graduation rate is a key part of a school district’s report card. From a community perspective, the overall graduation rate signals to outsiders and residents alike the ability of public schools to discharge their mandates well. And on an individual level, graduating from high school is a key milestone in a person’s life.
The measure is cohort based, starting with the size of the 9th grade class in each district, allowing for student transfers, and is calculated as the share of those graduating of the 9th grade class size.
For the most current year, 2024-2025, the overall rate in Spokane County public schools was 86%. This is in line with recent years dating to school year 2021-2022, when the rate peaked at 90%. Slow but sure progress characterizes the past decade here, as the rate was 82% in 2015-2016. For all years shown in the indicator, county public schools have outperformed the state average. 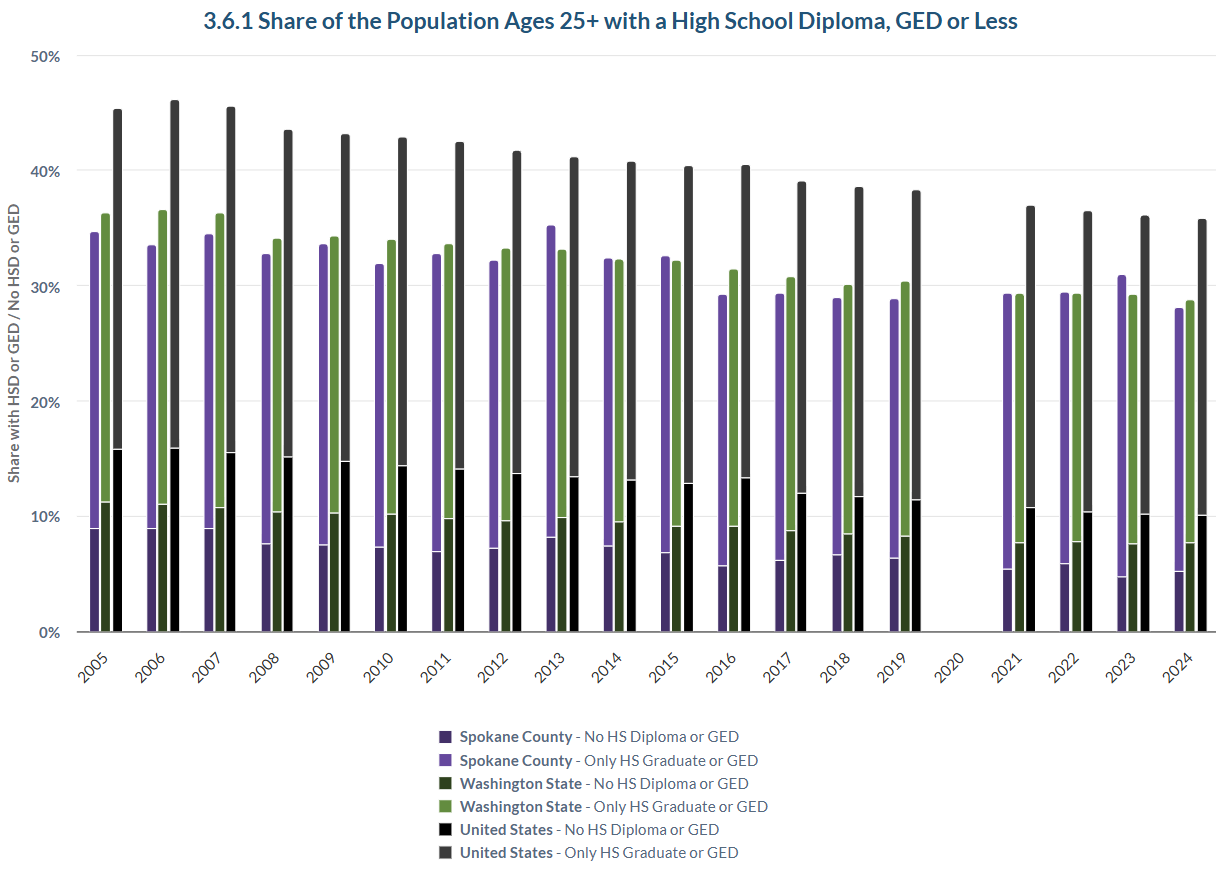
Considering the strong emphasis throughout the country in at least completing high school, this measure from Census gives insights into the trajectory of two groups with the lowest levels of formal education: those without a high school degree and those whose highest level of formal education is a high school diploma.
Ideally, one would like to see the former group’s share move toward zero. In the past, one applauded the decline the share whose highest achievement was a high school degree. Now as the workforce needs of the trades become more apparent, the interpretation of trend is less clear.
In 2024, the share of the county adult population (25+ years) without a high school degree was 5%. A decade ago, it was 7%. And its current value lies well below the shares for the U.S. and the state.
In the same year, the share of the county adult population whose highest degree achievement is a high school diploma was 23%. A decade ago, it was 26%. And the local share is a bit lower than the Washington average and considerably below the U.S. average.
To simplify the graph, click on the item(s) in the legend you would like to hide.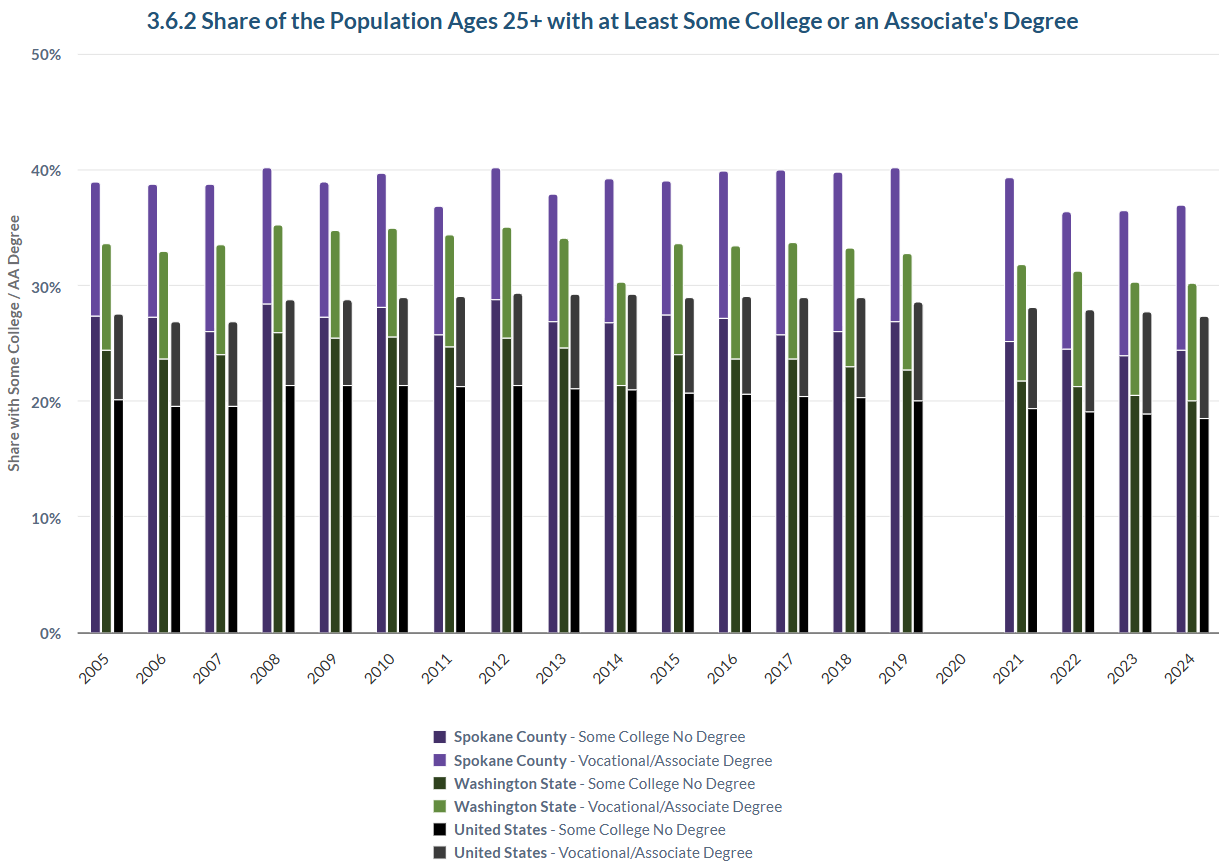
The educational profile of these groups is broad. The measure’s smaller portion, those with an associates or vocational degree, largely reflects the workforce needs of an area for those occupations not requiring a bachelor’s degree but some formal post-secondary training.
The measure’s larger portion, “some college but no degree” encompasses those who took targeted classes resulting in, say, a certificate; it also picks up those who started at either or 2- or 4-year institution, but did not finish.
The Census estimate for the county share of the former group in 2024 was nearly 13%; for the latter group 24%. Over the past decade, the share of county adults with an associate’s degree has grown slightly. The share of the “some college, no degree” group has diminished a bit. For both groups, Spokane County shows a higher concentration than either in the state or the nation.
To simplify the graph, click on the item(s) in the legend you would like to hide.
In HOUSING: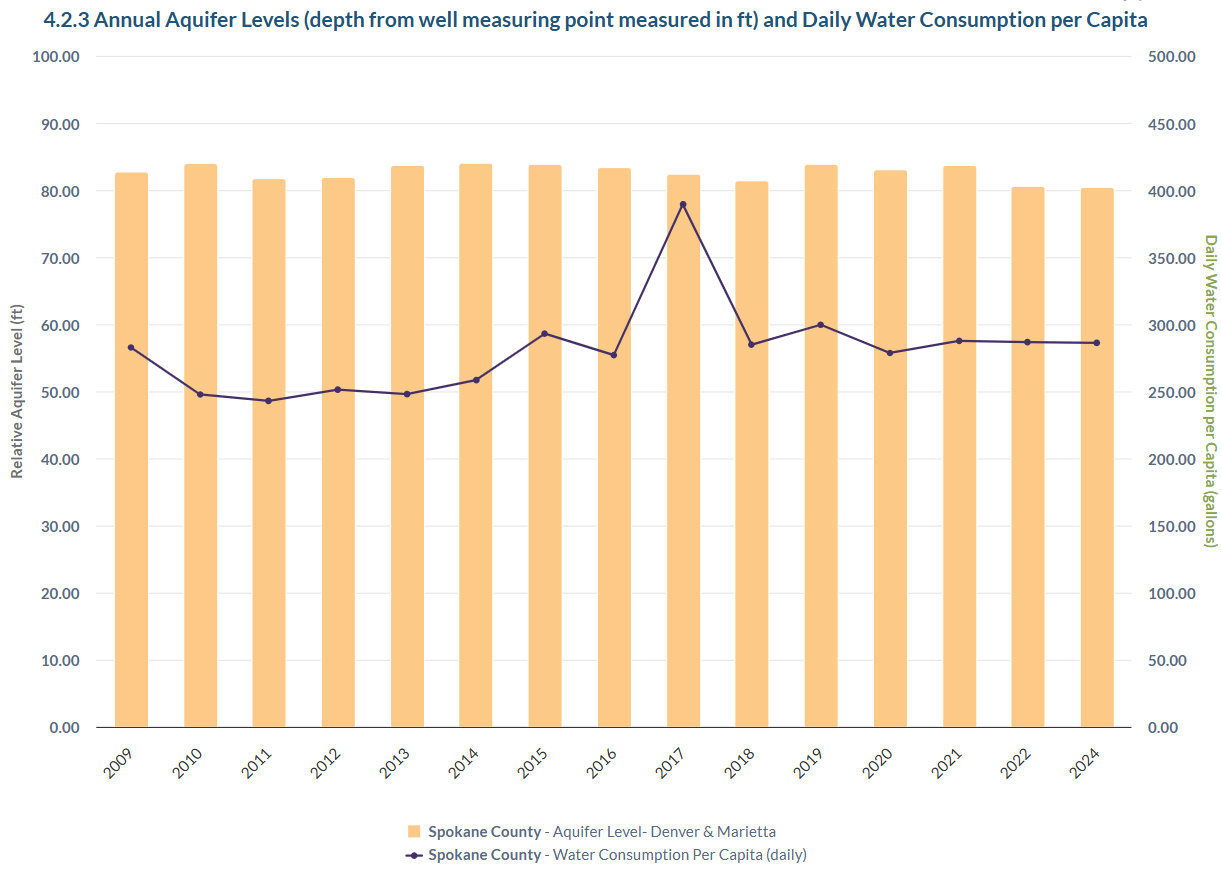
The annual average level of the Spokane-Rathdrum aquifer, as measured in Spokane, has declined.
The disappearance of flow in the Spokane River last August served as a wake-up call for this hugely important resource in our county. And it is well-known that there is a bi-directional flow between the river and the Spokane-Rathdrum aquifer. The aquifer is the sole source of drinking water for hundreds of thousands of people in the Spokane area.
This annual measure is a daily average of water height taken at a well at the intersection of Denver and Marietta streets in Spokane.
In 2024, the year with the latest published data, average height was 80.4 feet. This was considerably lower than in 2021, when the average was 83.7 feet. A decade ago, average water height was 83.9 feet. 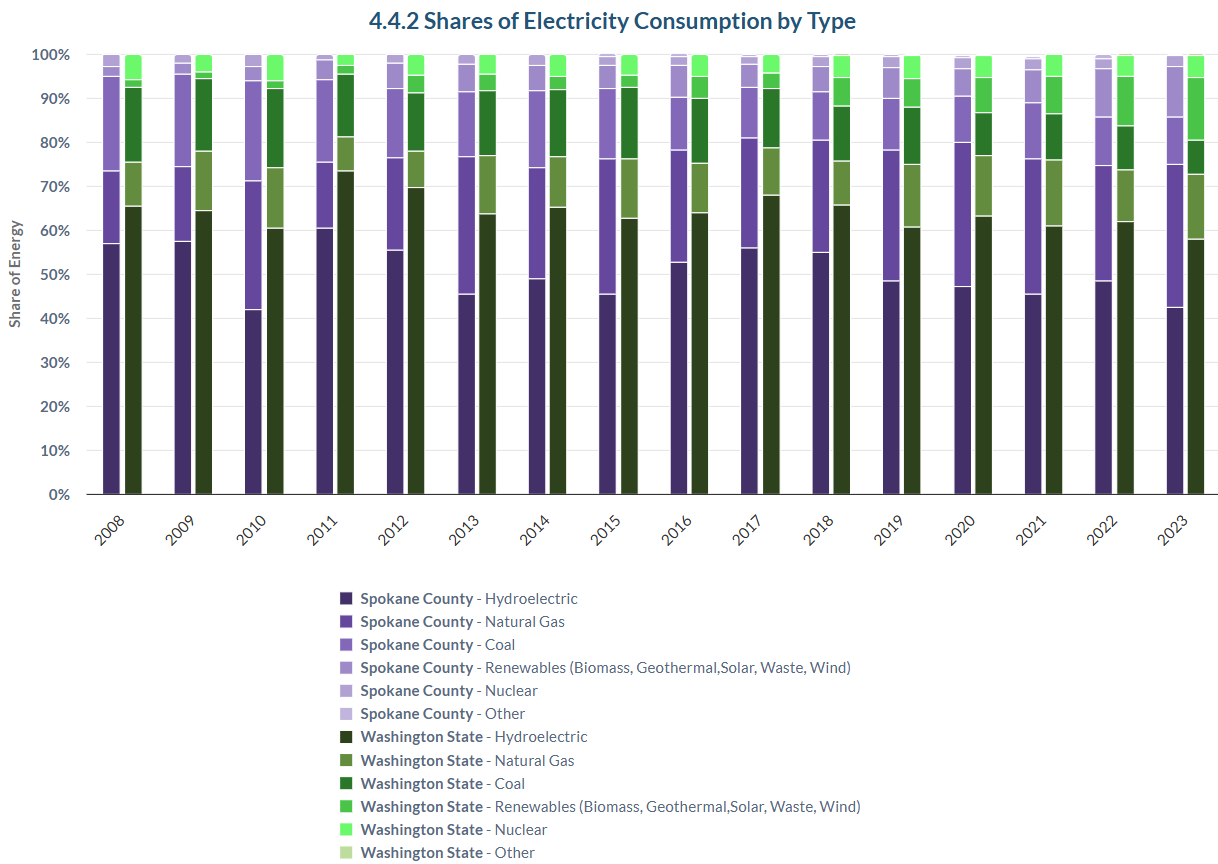
Shares of electricity by type.
In most Washington state counties, electricity consumed arrives from a variety of sources. Despite what might be the conventional wisdom about Spokane County’s sourcing of electrons, the same applies here, and not necessarily all from hydro.
In 2023, the most recent year that the Washington state Department of Commerce has calculated the “fuel mix,” the primary source was indeed hydropower, at 42% of the total. But this share was lower than a decade prior, when it stood at 48%. Natural gas claimed the second-largest share in the county, at 33%. This is considerably higher share than a decade ago, when it stood at 25%.
Coal-generated electricity is still not trivial, at 11% in 2023 in the county. But is it lower than a decade ago, when it stood at 18%. The largest change in the county’s electricity fuel mix has been renewables. In 2023, their share stood at 12%; a decade prior, at 6%. Except for the size of the renewables share here, the county mix is considerably different than the state-wide average.
To simplify the graph, click on the item(s) in the legend you would like to hide.
list updated 7.21.2026
The complete list of Spokane Trends can be found here.
New Intern Features

Janay Bowen
Hometown: San Jose, CA
Major: Professional Accounting
Expected Graduation Date: Spring 2027
Post-graduations plans: Work at a local accounting firm to become a CPA!
After a few months of working on the Trends project, my favorite thing so far: My favorite thing so far working on Trends projects is when I get into the flow state of work and I am understanding and creating spreadsheets that I know help the counties we work for.
About The Institute
The Institute for Public Policy and Economic Analysis is a research institute for applied regional research that provides easily accessible community indicator data. The Institute publishes nine community trend sites for thirteen Washington counties, all of which cover a variety of factors like economic vitality, health, housing, and more. The Institute’s work is aimed to promote data-based decision making and provide readily available and extensive data for communities across Washington state.